FIELD NOTE / AI ECONOMICS
Software Margin Tearsheet
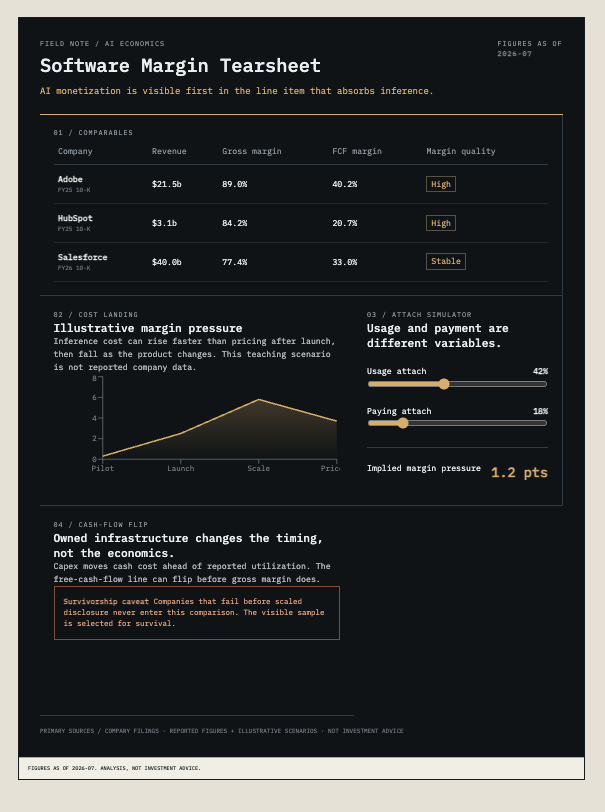
AI monetization is visible first in the line item that absorbs inference.FIGURES AS OF
2026-07
| Company | Revenue | Gross margin | FCF margin | Margin quality |
|---|---|---|---|---|
| AdobeFY25 10-K | $21.5b | 89.0% | 40.2% | High |
| HubSpotFY25 10-K | $3.1b | 84.2% | 20.7% | High |
| SalesforceFY26 10-K | $40.0b | 77.4% | 33.0% | Stable |
Illustrative margin pressure
Inference cost can rise faster than pricing after launch, then fall as the product changes. This teaching scenario is not reported company data.
Usage and payment are different variables.
Owned infrastructure changes the timing, not the economics.
Capex moves cash cost ahead of reported utilization. The free-cash-flow line can flip before gross margin does.
Open the public tearsheet
Explore the Software Margin Tearsheet - a ten-year, interactive view of 56 public software companies across 11 categories.
Start with the accounting boundary
Where does the cost of an AI feature appear when the financial statements do not name it? Product announcements describe capabilities. Financial statements describe revenue, cost of revenue, operating expense, capital investment, and cash flow. The analytical job is not to invent a hidden AI line item. It is to form a testable view of where incremental cost could appear, then look for evidence that supports or contradicts it.
Public companies must discuss known trends and uncertainties that are reasonably likely to have a material effect, but they do not have to itemize every product-level cost driver. The SEC has also said that existing rules may require AI-related disclosure when its use or risk is material to the business. That leaves a wide gap between “material to the company” and “useful for understanding one product.”
Item 303 of Regulation S-K sets the broad MD&A requirement. The SEC’s AI disclosure review statement explains how those existing obligations can apply to AI.
Read the statements as a system
No single metric resolves the question. The useful signal is the relationship among gross margin, free cash flow, R&D, growth, and the commercial model behind the product.
Gross margin
Gross margin is the first place to look when inference is treated as a cost of delivering the product. If an AI feature is included in a subscription, metered through a third-party API, or bundled into usage, incremental serving cost can appear in cost of revenue.
A lower margin does not prove AI caused it. Hosting contracts, acquisitions, service mix, pricing, and accounting policy can move the same line. The direction tells us where to investigate, not what verdict to reach.
Free cash flow
If a company buys or builds infrastructure, cash may leave before the expense reaches the income statement. Capital expenditure and working-capital movements can widen the gap between operating income and free cash flow, especially during a buildout. Stock-based compensation and each company’s definition of non-GAAP free cash flow also matter when comparing peers.
The gap is not uniquely AI. It is a prompt to check whether the economics sit below gross margin, outside the quarter’s operating expense, or in adjustments that are not comparable across companies.
R&D
R&D can absorb compute while a feature is being developed, before it is embedded in the product or used at meaningful scale. As usage moves into production, some cost may move closer to cost of revenue. The timing and classification depend on architecture, vendor contracts, and accounting policy.
Growth and pricing power
Growth shows whether the company is still expanding fast enough to absorb investment; it does not say whether the unit economics are sound. Pricing power is harder still. It depends on customer value, competitive alternatives, packaging, switching costs, and the share of AI usage that is paid rather than merely adopted.
The quiet case may be the most interesting. If AI usage rises and no financial line moves, the cost may still be immaterial, offset elsewhere, or not yet at production scale. “No movement” is an observation, not proof of free inference.
A guided tour of the instrument
1. Set the analytical frame

The opening view defines the comparison set: 56 public software companies, 11 categories, and fiscal years 2016 through 2025. It also states the boundary that governs every view: figures are fiscal-year-aligned approximations assembled for pattern analysis, not filing-grade data. The right next step is always to verify a material observation against the company’s 10-K, 10-Q, earnings materials, and accounting definitions.
2. Table: ten years, every company

The table brings growth, gross margin, free-cash-flow margin, Rule of 40, available net revenue retention, and ten-year margin paths into one sortable view. The latest figure is only a snapshot; the trajectory helps distinguish a structural pattern from a single-year move. Selecting a company opens its full FY2016–FY2025 history so the reader can inspect the sequence before forming a view.
3. Ten-year cohort: how Rule of 40 is built

Rule of 40 compresses two different economic engines into one number. A company reaching 40 through rapid growth is not equivalent to one reaching 40 through free cash flow, and the same company can move from one engine to the other as it matures. The cohort view keeps those components visible rather than treating the sum as the conclusion.
4. Rule of 40: growth versus cash

The scatterplot shows every company on the two axes that compose Rule of 40, with bubble size representing revenue. The diagonal is a reference line, not a valuation threshold. Position above or below it helps identify which companies deserve a closer look; it does not adjust for market structure, revenue quality, capital intensity, dilution, or valuation.
5. Trends: compare the path, not just the endpoint

The trend view compares as many as seven companies across gross margin, free-cash-flow margin, growth, or revenue. Side-by-side paths can reveal whether a move is company-specific, category-wide, or synchronized with a broader cycle. Fiscal-year alignment makes the comparison legible, but it can blur differences in reporting periods; the filings remain the source of record.
6. AI margin math: separate adoption from monetization

Usage attach and paying attach are separate because they answer different questions. A feature can be widely used and poorly monetized, or narrowly used by customers who pay enough to cover inference. The simulator connects customer count, feature usage, serving cost, and incremental revenue so a finance or product team can see which assumption changes the margin outcome. It is scenario analysis, not a forecast.
Pricing power is a hypothesis
The tearsheet’s pricing-power score is an analytical triage tool, not a performance ranking or target price. It asks how defensible the current price-to-cost relationship may be if inference becomes cheaper and more widely available. A high score is a reason to examine the source of customer value; a low score is a reason to test cost exposure and monetization. Neither is a conclusion about the security.
The default values are starting points, not industry averages. Change them. The useful result is not a single answer; it is discovering which assumption breaks first.
What this study cannot prove
The table uses public filings and reported company figures, with approximations and fiscal-year alignment for comparison. It cannot attribute a basis-point move to AI without company disclosure. Acquisition mix, restructuring, hosting contracts, pricing, stock-based compensation, capital intensity, and accounting policy can all produce similar patterns. Recent periods may include estimates where a fiscal year had not closed.
This is an independent analytical exercise, not investment advice or a recommendation to buy or sell a security. Any figure that matters to a decision should be checked against the company’s current filings and disclosures.